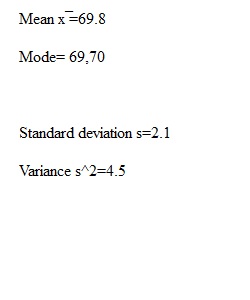
Q Common Assessment 1: Data Analysis Math 146 Purpose In this assignment you will practice analyzing a data set using descriptive statistics. It is assumed that you will enter the given data set into your calculator and have the tool compute the bulk of the requested values. In subsequent chapters of this course you will be asked to give descriptive statistics of data sets as a piece of a more detailed analysis of a situation. You will see descriptive statistics such as the ones in this assignment frequently in news reports, health reports (especially with the COVID19 outbreak), sports analyses, and academic articles in areas like psychology, sociology, and health care. The major goal of this assignment is to not only recognize what descriptive statistics are but to also state them with proper units. You likely see, and hear, descriptive statistics every day, in newsfeeds, in social feeds, podcasts on the radio, in your academic classes, etc. Understanding what these values represent is key in understanding the information you are consuming. Task Compute the requested descriptive statistics for the data set arising from the given scenario. A random sample of 30 college students is asked to report their height in inches. The data is given in the table below. 72 69 68 73 68 70 70 72 69 67 70 67 69 73 70 72 67 69 71 71 74 70 68 66 67 71 73 68 69 71 a. (3pts each)Determine the mean and mode b. (3pts each)Determine the standard deviation and variancec. (7pts)State the five-number summary
View Related Questions
_1650271991.jpeg)